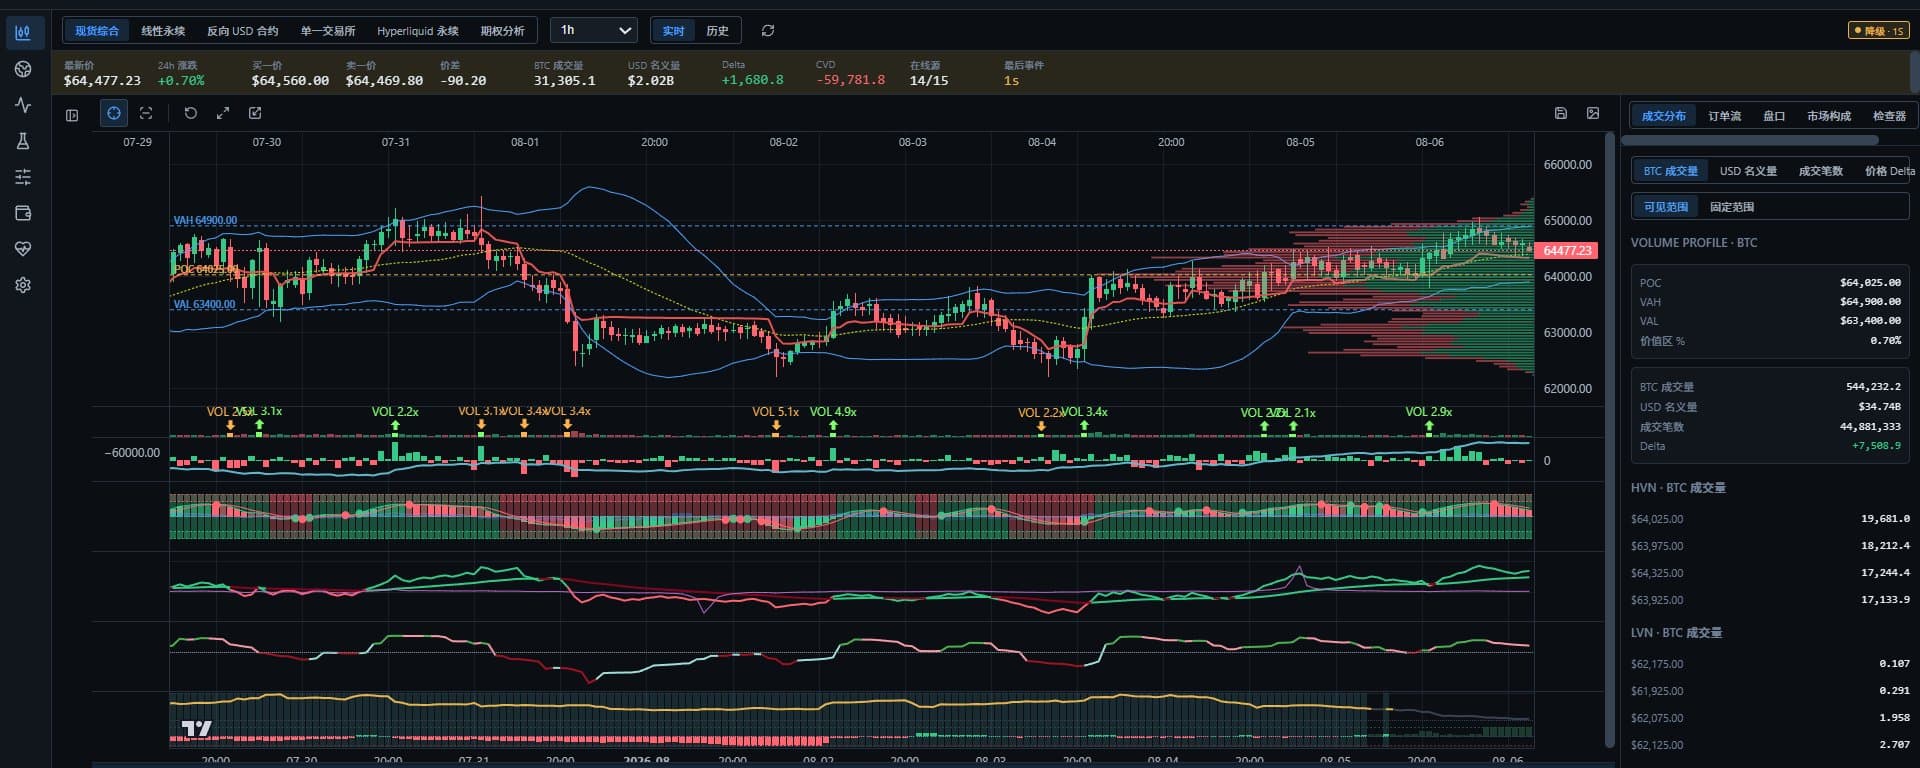
How to Interpret Felix's BTC Terminal Daily Push Notifications
The image below is a screenshot of the push notification sent around 8:00 AM Beijing time each morning. In essence, it is a pre-market analysis for BTC (primarily daily chart) written by a professional trader.
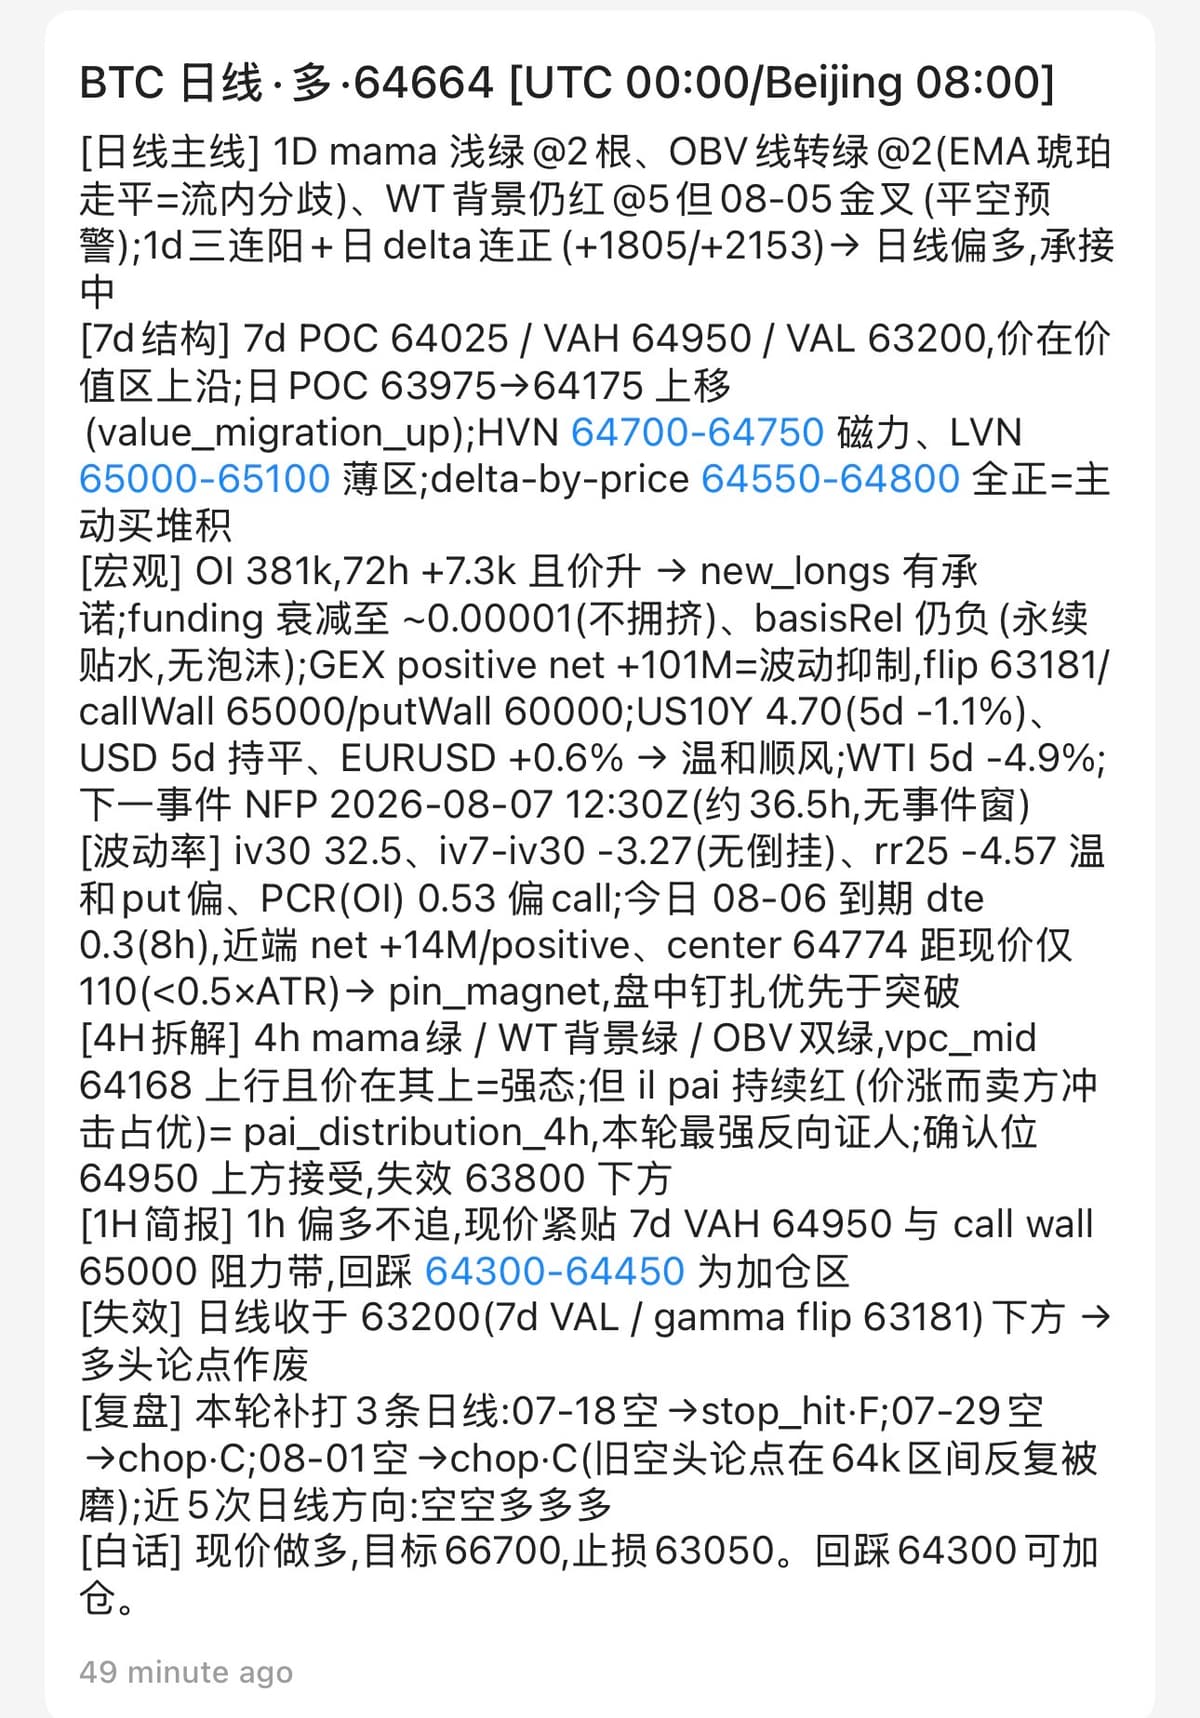
It contains a mix of:
If translated entirely into plain language, it’s not actually that complicated.
Part 1: [Daily Main Line]
Original:
1D mama light green @2, OBV line turns green @2, WT background still red @5...
Plain language:
The overall trend is now leaning bullish, but has not yet been fully confirmed.
A few abbreviations here:
① 1D
Day = Daily chart.
One candlestick represents one day.
② MAMA
MESA Adaptive Moving Average
A more intelligent moving average than a standard one.
It automatically adjusts based on the speed of the market.
Here it says:
mama light green
Meaning:
This trend line has already started to rise.
Two consecutive candles are both green.
This indicates:
Bulls are beginning to dominate.
③ OBV
On Balance Volume
In Chinese:
Energy Tide Indicator
Its function:
Check whether money is quietly being bought.
For example:
Price hasn’t risen much.
But OBV keeps rising.
Indicates:
Funds have already entered in advance.
Price is likely to rise later.
Here:
OBV turns green
Meaning:
Funds are starting to flow in.
④ EMA
Exponential Moving Average
An exponential moving average.
It reacts faster than MA (simple moving average).
Here:
EMA amber flat
Meaning:
The long-term trend has not yet truly started to rise.
It has only stopped declining.
⑤ WT
WaveTrend
An oscillator indicator.
Similar to MACD.
Here:
WT background still red
Indicates:
The medium-term trend has not yet fully turned strong.
So:
It is rising,
But there is still risk.
⑥ Delta
Trade volume difference.
Formula:
Active buy orders − Active sell orders
For example:
Active buys:
100 BTC
Active sells:
60 BTC
Delta:
+40
Indicates:
Buyers are more aggressive.
Here:
delta positive for two consecutive days
Meaning:
For two consecutive days,
Active buying orders have dominated.
So:
Leaning bullish.
He says:
Three consecutive bullish candles + delta positive for consecutive days
Translation:
Three consecutive days of upward movement, and each day buyers were actively attacking.
This is a relatively healthy uptrend.
Part 2: [7-Day Structure]
Here we start discussing the market's volume distribution.
Most important.
POC
Point Of Control
The price level with the highest trading volume.
Can be understood as:
The price the market considers most reasonable.
Here:
64025
Meaning:
Over the past seven days,
Most people traded at 64025.
So:
This level has the strongest support.
VA
Value Area
The value area.
Means:
70% of all trading volume occurred within this range.
It contains:
VAH
VAL
VAH
Value Area High
The top of the value area.
Here:
64950
Meaning:
Near 64950,
It starts entering a relatively expensive zone.
Price is likely to encounter resistance when rising.
VAL
Value Area Low
The bottom of the value area.
63200
Meaning:
If it falls to this level,
It starts entering a cheap zone.
Buying orders are likely to appear.
In one sentence:
63200~64950
Is:
The price range the market recently considers reasonable.
Value Migration Up
The value area as a whole is moving upward.
What does this mean?
Previously:
People thought:
63000 was reasonable.
Later:
More and more people accept 64000.
Indicates:
The overall market cost is rising.
This is:
An uptrend.
HVN
High Volume Node
A zone with high trading volume.
64700~64750
Means:
Many people traded here.
Typically:
Price tends to pause here.
Oscillating back and forth.
LVN
Low Volume Node
A zone with low trading volume.
65000~65100
What does it mean?
No one traded.
So:
Price can easily pass through quickly.
Like a highway.
Delta By Price
The Delta value at each price level.
Here:
64550~64800
All positive.
Indicates:
The entire segment consists of active buying orders.
Not a fake breakout.
Part 3: [Macro]
Here we start looking at the global markets.
OI
Open Interest
The number of contracts still open.
Here:
381k
Means:
381,000 BTC contracts.
He says:
OI increasing
Price also rising.
Indicates:
New funds have entered.
Not short covering.
This is:
A genuine rise.
New Longs
Newly opened long positions.
Means:
More and more people are starting to go long.
Not old shorts giving up.
Funding
Funding Rate
The funding rate for perpetual contracts.
If:
Funding is very high:
Indicates:
Too many people are long.
Prone to a sharp drop.
If:
Funding is near 0:
Indicates:
The market is very healthy.
Here:
0.00001
Almost nothing.
So:
No bubble in the rise.
Basis
Basis
Futures price
Minus
Spot price.
If:
Basis is very high:
Indicates:
Market is overheated.
Here:
Still negative.
Meaning:
No bubble.
GEX
Gamma Exposure
Market maker's gamma exposure.
Layman can understand as:
Whether market makers will suppress the price.
Here:
Positive Gamma
Indicates:
Price is likely to stabilize.
No wild swings.
Flip
Gamma Flip
The level where market makers start changing their trading direction.
63181
If it breaks below this level,
Volatility may suddenly increase.
Call Wall
A large concentration of call options.
65000
Meaning:
Many people bought call options at 65000.
So:
It is likely to form resistance.
Put Wall
A large concentration of put options.
60000.
It is likely to form support.
US10Y
US 10-year Treasury yield.
The most important interest rate globally.
Generally:
When yield falls:
Risk assets (BTC, stocks)
Tend to rise.
EURUSD
Euro vs US Dollar.
Rising:
Indicates:
The US dollar is weakening.
Typically:
BTC tends to rise.
WTI
US crude oil.
Here it is just a macro reference.
Has less impact.
NFP
Non-Farm Payroll
US non-farm employment data.
One of the most important monthly data releases.
After it is released:
BTC often experiences sharp volatility.
Part 4: [Volatility]
IV
Implied Volatility
The market's expectation of future large up or down moves.
Here:
IV30
Expected for the next 30 days.
RR25
Risk Reversal
Call options
Vs
Put options
Which one is more expensive.
Negative:
Indicates:
Market prefers to buy Puts.
More cautious.
PCR
Put Call Ratio
Put options
Divided by
Call options.
Greater than 1:
Pessimistic.
Less than 1:
Optimistic.
Here:
0.53
Indicates:
More Calls.
Market is leaning optimistic.
DTE
Days To Expiration
How many days until option expiration.
Here:
8 hours.
So:
Today's volatility is likely to be suppressed.
Pin Magnet
Magnet effect.
Near option expiration,
Price tends to be attracted to a certain level.
Here:
64774
Today, price is likely to oscillate around 64774.
Part 5: [4-Hour]
He says:
4-hour:
MAMA green
WT green
OBV green
All leaning bullish.
But:
PAI is still red.
PAI
Price Aggression Index
Can be understood as:
Sellers' counterattack is still relatively fierce.
So:
Although the trend is upward,
The rise will not be particularly smooth.
Part 6: [1-Hour]
He says:
Do not chase highs.
If:
64300~64450
Is retested,
Consider adding positions.
Because:
Support there is strong.
Part 7: [Invalidation Condition]
He says:
If:
Daily chart breaks below 63200,
Indicates:
The entire bullish logic fails.
Need to reassess.
Last sentence (Trading advice)
Original:
Buy at current price, target 66700, stop loss 63050, add on pullback to 64300
Translation:
His trading plan is:
Core Message of the Entire Report
If summarized in one plain sentence, it is:
From multiple dimensions including trend, volume, capital flow, futures open interest, options, and macro environment, Bitcoin is currently leaning bullish overall, and it is a "healthy rise," not a frantic chase. The short-term biggest resistance is around 65000. If it breaks and holds above 64950~65000, there is an opportunity to continue challenging 66700; if it breaks below 63200, this round of bullish logic essentially fails.
The greatest value of this type of report lies not in any single indicator, but in cross-validating multiple independent signals. Looking at MAMA, OBV, OI, or Funding alone can lead to misjudgment, but when they all point in the same direction, the reliability of the judgment increases significantly.
The above is ChatGPT's explanation. This line-breaking style has been criticized by countless people recently, so bear with it.
It's roughly like this.
This time I did not use historical data backtesting and fitting, but instead evolved the AI interpretation skill through self-scoring review.
At the same time, there is also a GPT 5.6 Sol back-to-back version (not pushed externally).
Both paths will eventually require about 90 days to complete the first phase of confidence calibration.
Stay tuned~